
Inspection of the Scottish Fire and Rescue Service West Service Delivery Area
Related Downloads
Inspection of local service delivery within the West Service Delivery Area (WSDA)
Overview of incident data in the WSDA
- In the year to 31 March 2023 there were 18 fatalities in accidental dwelling fires in the WSDA an increase of 8 from the previous year
- There were 353 accidental dwelling fire non-fatal casualties.
- Of the 26,522 reported fire false alarms, 57% (14,817) were unwanted fire alarm signals.
- Those 14,817 UFAS calls resulted in a total of 23,486 fire appliance mobilisations in the year to 31 March 2023.
- Fire stations in the WSDA attended a total of 47,699 incidents in the year to 31 March 2023.
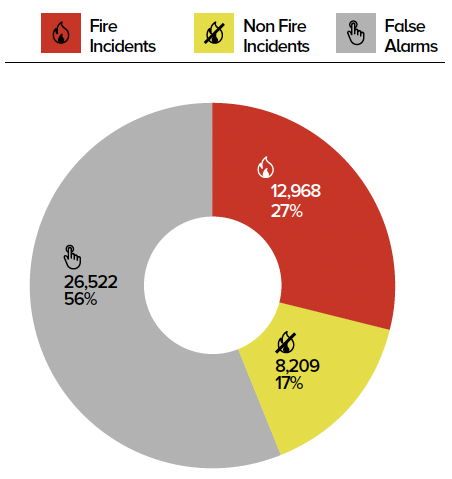
Pie Chart which shows the split of incident types in numbers and percentages. Split of incident types shown includes Fire Incidents 12,968 (27%), Non Fire Incidents 8,209 (17%) and False Alarms 26,522 (56%).
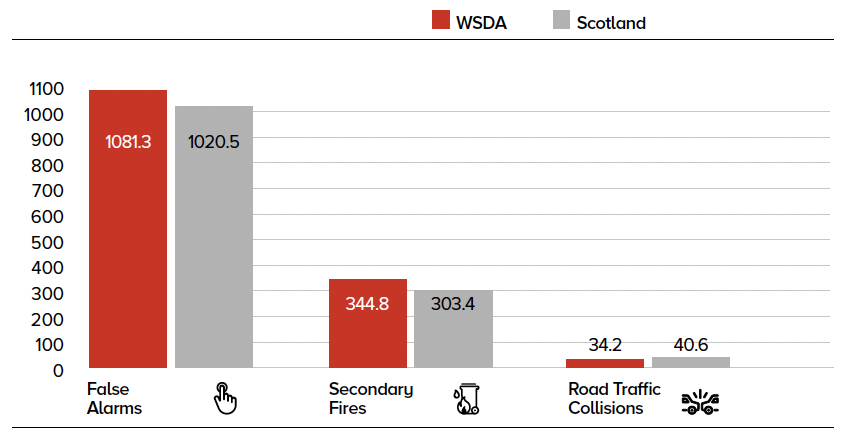
This graph including the table below shows the comparison of the rate of false alarms, secondary fires and road traffic collision incidents per 100,000 population for the year 2022-23 between the West SDA and Scotland as a whole.
| False Alarms | Secondary Fires | Road Traffic Collisions | |
| WSDA | 1081.3 | 344.8 | 34.2 |
| Scotland | 1020.5 | 303.4 | 40.6 |
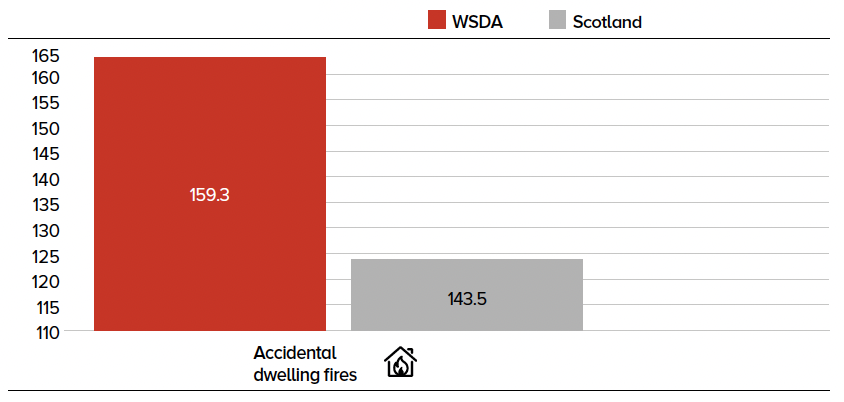
This graph shows the comparison of the rate of accidental dwelling fires per 100,000 dwelling properties for the year 2022-23 between the West SDA 159.3 and Scotland 143.5.
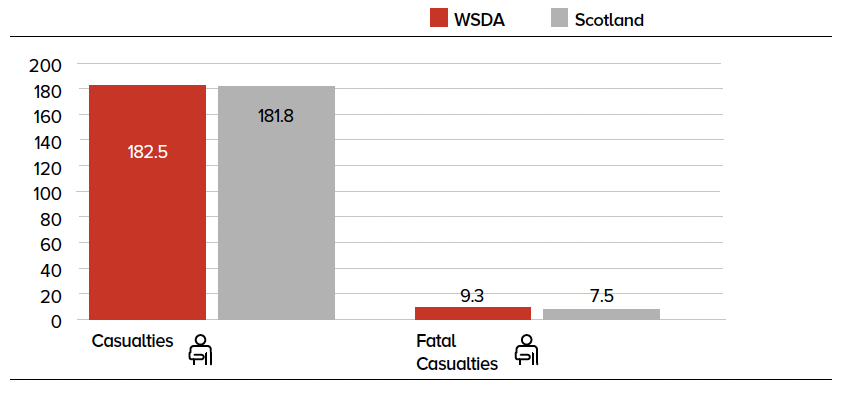
This graph including the table below shows the comparison of the number of casualties per 1,000 fires for the year 2022-23 between the West SDA and Scotland as a whole.
| Casualties | Fatal Casualties | |
| WSDA | 182.5 | 9.3 |
| Scotland | 181.8 | 7.5 |
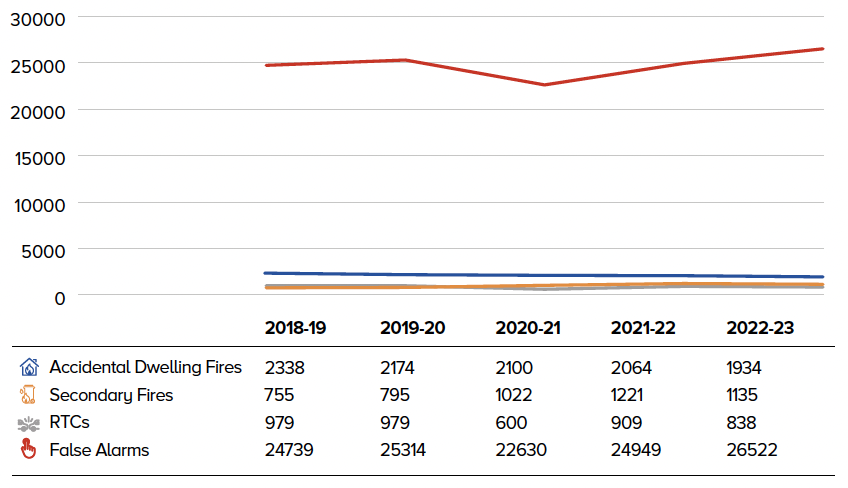
5-Year trend of 4 different incident types between 2018-19 and 2022-23 which includes accidental dwelling fires, secondary fires, RTCs and false alarms.
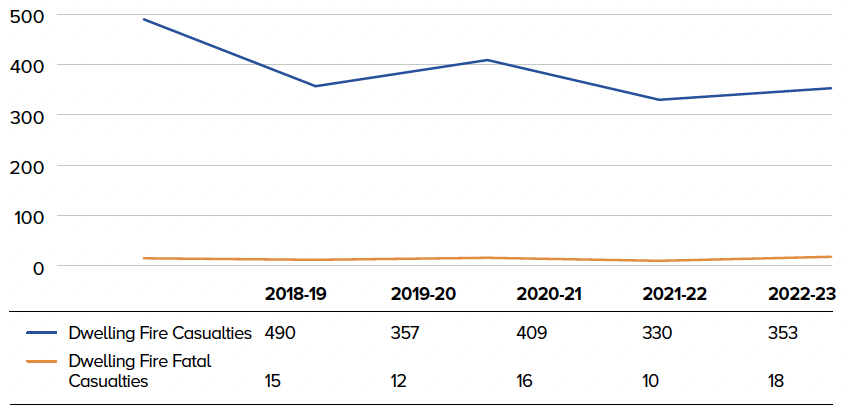
5-Year trend of dwelling fire casualty numbers between 2018-19 and 2022-23 which includes dwelling fire casualties and dwelling fire fatal casualties.
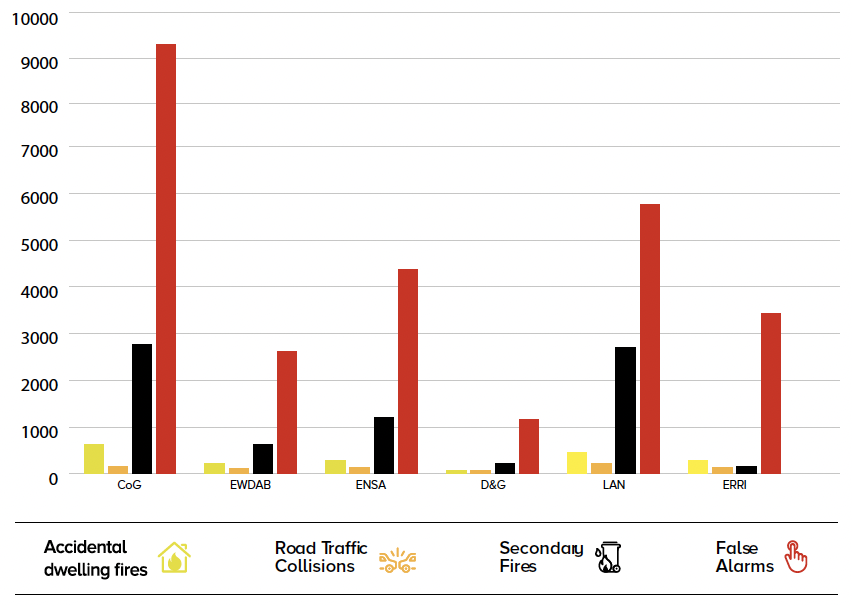
| Accidental Dwelling Fires | Road Traffic Collisions | Secondary Fires | False Alarms | |
| City of Glasgow | 626 | 155 | 2768 | 9190 |
|
East Dunbartonshire, West Dunbartonshire and Argyll and Bute |
211 | 112 | 625 | 2612 |
|
East, North and South Ayrshire |
291 | 143 | 1198 | 4366 |
|
Dumfries and Galloway |
80 | 78 | 216 | 1152 |
|
Lanarkshire |
451 | 223 | 2698 | 5762 |
|
East Renfrewshire, Renfrewshire and Inverclyde |
275 | 127 | 952 | 3440 |